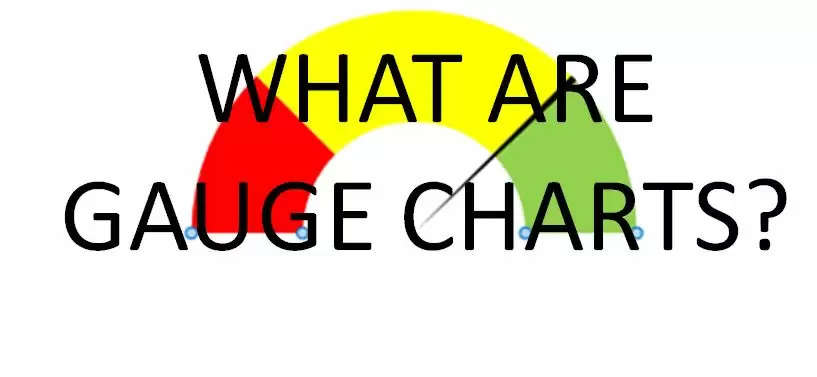
What are Gauge Charts?
Gauge charts are often used to display performance data, such as CPU utilization or disk space usage. They can also show progress towards a goal, such as the number of sales made so far this month.
Gauge charts are an efficient way to compare data sets and track progress over time. Using a gauge chart, you can quickly see how your data sets relate to and identify any trends. Additionally, gauge charts are easy to create and interpret, making them an ideal tool for data visualization. Keep reading to learn more about the significant advantages of gauge charts.
What are gauge charts?
A gauge chart, also known as a speedometer chart, is a graphical representation of data that uses a radial dial or pointer to indicate the magnitude of a particular value. Gauge charts are often used to display performance data, such as CPU utilization or disk space usage. They can also show progress towards a goal, such as the number of sales made so far this month. There are numerous advantages of gauge charts.
One of the benefits includes versatility, as gauge charts can display any type of data, including text, numbers, and percentages. These charts are also easy to read because the radial dial or pointer makes it easy to quickly see the magnitude of the data values being displayed. Gauge charts are also updated in real-time, meaning as new information becomes available, gauge charts can be updated to reflect the latest data. Lastly, gauge charts are intuitive, as in they are immediately understandable by most people, making them an effective way to communicate performance information.
How do you make a gauge chart?
The easiest way to make is gauge chart is by using Excel. Excel is a software application that allows you to store and organize data. Excel can be easily shared with other people, making it an excellent collaborative work tool. Excel also includes powerful data analysis features that allow you to perform complex calculations and compile data into graphs and charts. There are a few different ways to make a gauge chart, and the best way to make one will depend on the data you have and the type of chart you want to create.
One way to make a gauge chart is to use a table. Start by creating a table with two columns. In the first column, list the goals or objectives you want to track. In the second column, list the progress or percentage of completion for each goal. Once you have created the table, you can use a bar chart to make your gauge chart. To create the bar chart, start by selecting the data in the second column. Then, go to the Insert tab and select the bar chart icon. Choose the first bar chart type, and your chart will be created.
What type of businesses use gauge charts?
Almost any type of business can use gauge charts to track performance. Some of the most common types of companies that use gauge charts are manufacturing industries, healthcare businesses, and financial businesses. Manufacturing businesses use gauge charts to track the production process. The gauge chart will show the amount of product produced compared to the goal for the day. This will help the business to identify any bottlenecks in the production process.
Healthcare businesses use gauge charts to track the patient's vital signs. The gauge chart will show the patient's heart rate, blood pressure, and other vital signs. This will help the healthcare business identify any problems with the patient's health. Financial companies use gauge charts to track the stock market. The gauge chart will show the stock market's current value compared to the goal for the day. This will help the financial business identify any stock market trends.
Conclusion
Overall, gauge charts are an essential tool for visualizing data. They allow you to quickly and easily compare different data sets, and can help you identify trends and patterns. Additionally, they can be used to track progress over time or to compare performance against goals.
To join us on Facebook Click Here and Subscribe to UdaipurTimes Broadcast channels on GoogleNews | Telegram | Signal


